

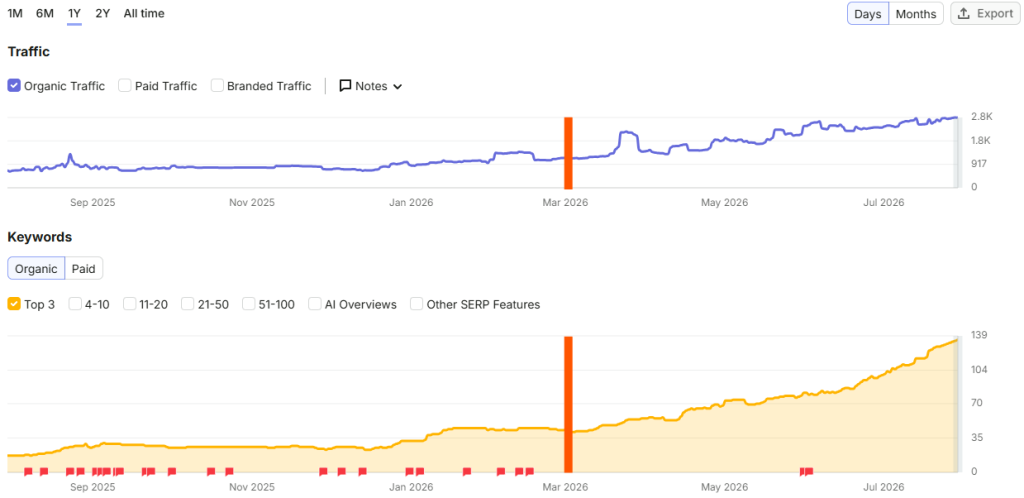
At a glance
| Metric | March 2026 | July 2026 | Change |
|---|---|---|---|
| Keywords ranking in the top 3 | 58 | 147 | +153% |
| Keywords ranking in the top 10 | 219 | 316 | +44% |
| Keywords stuck on pages 6 to 10 | 62 | 1 | Cleared |
| Median ranking position | 10 | 5 | Up 5 places |
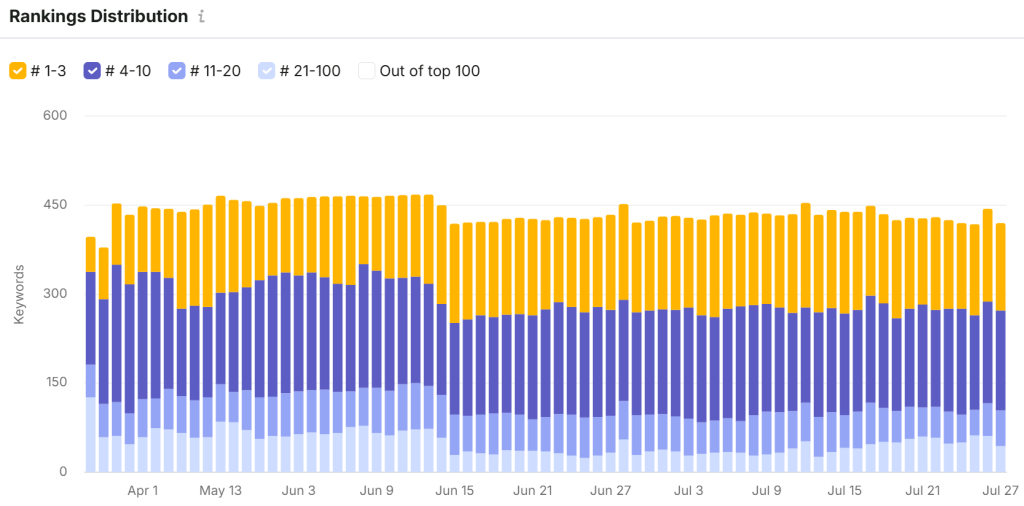
| Share of local search visibility | 13.4% | 24.12% | +10.72 pts |
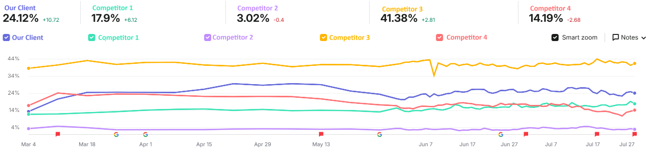
Alongside that, the business now appears in 66 AI-generated answers across Google AI Overviews, ChatGPT and Google AI Mode, and is the most frequently cited source in its category, ahead of a well-known national competitor operating in the same city.
No new content was published. No paid media was involved. No site rebuild. One backlink.
The situation
This is a business with a genuinely good reputation. More than 1,200 five star Google reviews, a real team rather than a single operator, same day availability, and upfront pricing across residential and commercial waste removal in Melbourne.
The website was not reflecting any of that.
They were competing against a global franchise with a national marketing budget and two well-funded local operators. On the keywords that actually generate bookings, they were sitting on page two and below. The site had been through previous SEO work and previous ownership, and it showed: broken internal links pointing at pages that no longer existed, heading structures that had been invented rather than nested, and page titles written for a version of Google that stopped existing years ago.
The brief was simple. More rankings on commercial terms. More leads from organic. And a secondary objective that most rubbish removal businesses have not thought about yet: start showing up when someone asks an AI assistant who to call.
What we found
We ran a 60-point technical review of the site in March 2026. Ten issues came back.
Links and crawlability
- 25 redirect chains. Internal links passing through two or three hops before landing anywhere. Every hop leaks a little authority and adds a little load time.
- 39 broken internal links across 21 pages, all pointing at just four dead destinations: a team page that had been deleted, an author archive, and two external government resources that had quietly moved. One of them was linked from the homepage.
- Three non-descriptive internal anchors, including a link labelled simply “here” that pointed at the wrong page entirely.
Directives and sitemaps
- XML sitemap issues, flagged high priority.
- No image sitemap at all.
Content tagging
- 14 page titles over the 60 character limit, meaning they were being truncated in search results before the reader got to the value proposition.
- 22 meta descriptions over 156 characters, one of them running to 212.
- Five blog pages with no H1 at all, each running an H2 as the top level heading.
- 42 images with no alt text, including the hero images on the primary service pages.
Structure
The homepage was using heading levels that do not exist. Tags like h32, h43 and h54 had been introduced at some point, which meant the document outline that search engines and screen readers rely on was effectively unreadable.
What we did
Seven workstreams over five months. No silver bullets.
1. Technical remediation
Collapsed the redirect chains to single hops. Repaired or removed all 39 broken internal links. Rewrote the three weak anchors to describe their destinations. Fixed the sitemap issues and the missing image sitemap.
None of this is glamorous. All of it is the difference between a crawler understanding your site and a crawler guessing.
2. Heading structure
Rebuilt the homepage heading hierarchy from invented levels into a clean H1 to H5 outline. Added H1s to the five blog pages that had none.
This matters more now than it used to. Generative engines lean heavily on document structure to work out which chunk of a page answers which question, so a broken outline is not just an accessibility problem, it is a citation problem.
3. Metadata
Wrote new page titles, H1s and meta descriptions for 71 URLs, including 33 suburb pages.
- Page titles over 60 characters: 14 before, 0 after
- Meta descriptions over 156 characters: 22 before, 0 after
The interesting detail is that average title length went up, from 49.6 to 57.4 characters. This was not a trimming exercise. Most of these titles were not too long, they were too vague, and the space they were not using was space a competitor was.
Worked example, homepage:
| Before | After | |
|---|---|---|
| Title | 71 characters, keyword stuffed, truncated in results | 55 characters, service and location led |
| Meta description | 194 characters, cut off mid-sentence | 144 characters, leads with same-day pickup, upfront pricing and a free quote |
| H1 | Rubbish Removal Melbourne | Affordable and Reliable Rubbish Removal in Melbourne |
4. Copy on target service pages
Rewrote the body copy on the primary commercial pages: couch and furniture removal, white goods removal, construction waste and end of lease. Added location qualifiers where the intent was local, restructured the FAQ blocks into question headings with a direct answer underneath, and tightened the internal links between related services.
The FAQ restructure was deliberate. A question as a heading with a short, complete answer immediately below it is the single most extractable content format there is, for featured snippets and for AI answers alike.
5. Alt text
Wrote descriptive alt text for all 42 images that had none. Not keyword stuffing. Descriptions of what is actually in the frame, with the service and the city included where they were genuinely relevant.
6. Navigation
Restructured the mega menu to separate residential and commercial services. The business wanted to grow its B2B side and the navigation was treating a facility manager and a homeowner as the same visitor.
7. One backlink
One guest-contributed article on an Australian regional news publication with a Domain Rating of 28. We wrote the piece. It went live around 19 May 2026, with the brand name as the anchor.
That is the entire link building programme. One link.
What happened: rankings
Across 494 tracked keywords, between 4 March and 27 July 2026:
| Metric | Start | End | Change |
|---|---|---|---|
| Top 3 positions | 58 | 147 | +153% |
| Top 10 positions | 219 | 316 | +44% |
| Positions 51 to 100 | 62 | 1 | Cleared |
| Median position | 10 | 5 | Up 5 places |
288 keywords improved. 146 declined. That second number is real and we are including it, because a case study that shows only the wins is not a case study, it is an advertisement.
68 keywords moved into the top three between April and July alone, including the terms that actually pay for the trucks:
| Keyword | Monthly searches | April | July |
|---|---|---|---|
| garbage removal melbourne | 1,300 | 5 | 1 |
| rubbish removal melbourne | 1,900 | 5 | 3 |
| rubbish removal service | 880 | 10 | 3 |
| furniture disposal | 320 | 21 | 3 |
| rubbish removal richmond | 320 | 10 | 1 |
| commercial rubbish removal melbourne | 210 | 52 | 1 |
| renovation rubbish removal | 210 | 15 | 1 |
Top three rankings now cover 35,240 monthly searches, and 129 of those 190 keywords carry commercial or transactional intent. This is not vanity ranking on informational terms. It is ranking on the phrases people type when they are ready to book.
What happened: share of voice
The clearest way to read a competitive market is not your own numbers, it is your slice of the total.
| Site | Visibility share, July 2026 | Change since March |
|---|---|---|
| A large local competitor | 41.38% | +2.81 |
| Our client | 24.12% | +10.72 |
| A second local competitor | 17.90% | +6.12 |
| A well-known national competitor | 14.19% | -2.68 |
| A third local competitor | 3.02% | -0.40 |
The client gained more visibility share than any competitor in the market, and moved past a well-known national brand while doing it. In a market where everyone is bidding on the same terms, share of voice is the only ranking metric that accounts for what your competitors are doing at the same time.
What happened: AI visibility
This is where it gets interesting, and where most SEO reporting still has a blind spot.
| Platform | Mentions | Pages cited |
|---|---|---|
| Google AI Overviews | 49 | 11 |
| ChatGPT | 13 | 9 |
| Google AI Mode | 4 | 7 |
| Total | 66 | 20 |
Across the AI prompts tracked for this category, the client’s site is now the most cited source, with 50 mentions. The nearest competitor, a well-known national brand, has 28.
The site also holds an AI Overview placement on 66 of its tracked keywords. For context, an AI Overview now appears on more than half of the search results this business competes in. Ranking first on a page where the answer has already been given above the fold is worth considerably less than being the source that answer was drawn from.
None of this required a separate GEO campaign. It came from the same fundamentals: a readable heading structure, direct answers under question headings, accurate metadata and clean internal linking. Generative engines are reading the same signals search engines are, they are just doing something different with them.
What happened: where the leads actually went
Here is the part that matters, and the part that would have been missed by any report that only looks at website traffic.
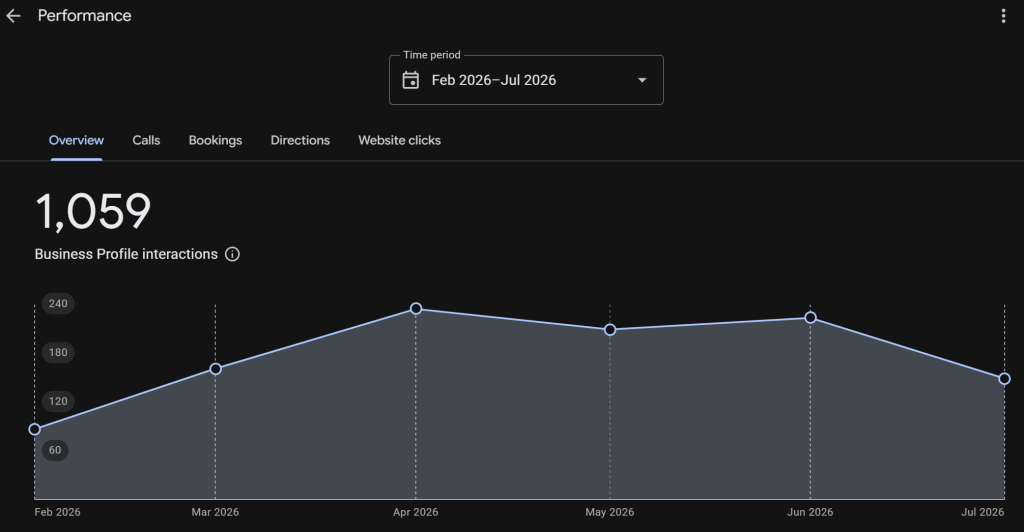
Google Business Profile performance, February to July 2026:
| Metric | Total |
|---|---|
| Business Profile interactions | 1,046 |
| Calls direct from the profile | 175 |
| Direction requests | 310 |
| Website clicks from the profile | 561 |
| Profile views | 15,894 |
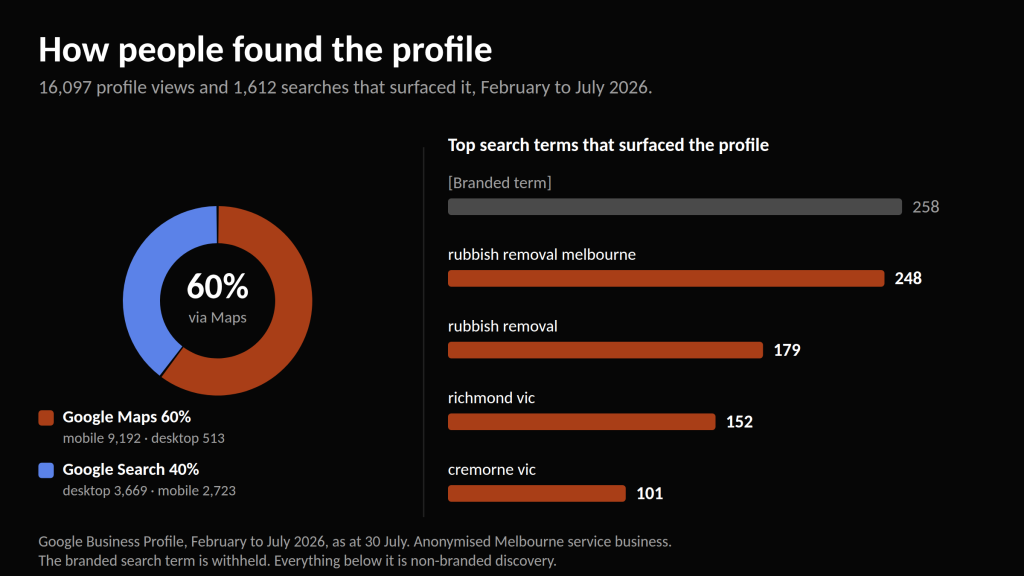
| Searches that surfaced the profile | 1,612 |
February 2026, the month before the work started, was the lowest month in the entire window on every single one of these measures. Interactions roughly tripled by April. Calls went from around ten in February to more than sixty in April.
Just as importantly, most of the searches surfacing the profile are not people looking for the brand. The top non-branded discovery terms were “rubbish removal melbourne” with 248 searches and “rubbish removal” with 179. These are people who did not know the business existed.
Of everyone who found the profile, 61% came through Google Maps rather than Google Search. Those interactions produce phone calls and direction requests. They do not produce website sessions, and they will never appear in a traffic report.
What happened: conversion quality
Across the five service pages that received the full on-page treatment, comparing the engagement period against the equivalent period before it:
| Metric | Before | After | Change |
|---|---|---|---|
| Organic sessions | 613 | 791 | +29% |
| Organic conversions | 89 | 134 | +51% |
| Conversion rate | 14.5% | 16.9% | +17% |
Site-wide, organic sessions fell about 19% across the same window, which is exactly what you would expect going from Melbourne’s peak season into its quietest months. The pages we optimised went the other way. They took more sessions and converted a higher proportion of them.
What we did not do
Worth stating plainly, because it is the most useful part of this case study for anyone weighing up a proposal.
- No new content. Not a single new blog post was published during the engagement.
- No paid media. None of the results above involve advertising spend.
- No site rebuild. Same WordPress install, same theme, same templates.
- No page speed work. The audit found no meaningful speed problem, so we did not invent one.
- One backlink. A single guest-contributed article on a Domain Rating 28 regional publication.
- No schema markup yet. FAQ schema was specified but has not been deployed. Everything above was achieved without it.
The last point is the one we would underline. Structured data is still on the to-do list, and the AI citation results arrived anyway. If your agency is telling you that appearing in AI answers requires an exotic new service line, they are selling you something. It mostly requires doing the fundamentals properly and structuring your content so a machine can find the answer in it.
What we would do next
- Deploy the FAQ, LocalBusiness and Service schema that has already been specified.
- Build out the commercial vertical pages: aged care, childcare, property managers and body corporates.
- Refresh the seasonal content that declined, particularly the hard rubbish guide, ahead of spring.
- Expand suburb coverage into Melbourne CBD, Fitzroy and Brunswick.
- Set up proper AI citation tracking, so the 66 mentions become a monitored metric rather than a snapshot.
Methodology and limitations
We would rather tell you where the data is soft than have you find out later. There is a longer version of this argument in our companion article, Rankings Up but Traffic Flat? Here Is Why.
Ranking and visibility data comes from SEMrush Position Tracking across 494 keywords, and SEMrush Organic Research snapshots taken on 14 April and 27 July 2026. Of the 420 tracked keywords now ranking, 152 are classic organic listings and the remainder are local pack, review carousel and AI Overview placements. All are valuable. They are not all blue links, and we are not going to imply that they are.
Website clicks were roughly flat. Search Console recorded a 7.3% fall in clicks between the engagement period and the preceding five months, against a 7.6% rise in impressions and an average position improvement from 20.26 to 17.72. Three things account for that fall, and all three are worth understanding.
- In Melbourne, rubbish removal peaks in spring and summer. The comparison period, October to February, is the busiest stretch of the year. The engagement period, March to July, is the quietest. We are comparing the client’s best five months against their worst five months. A 16-month data retention limit in Search Console meant a full year on year comparison was not available.
- One seasonal blog post. A single article about hard rubbish collection lost 233 clicks as its season passed. That one page accounts for more than the entire site-wide decline. Exclude it and the rest of the site was flat.
- Branded search fell 25%. Fewer people searched the business by name, which is a function of offline activity and word of mouth rather than search performance. Non-branded impressions rose 11.8% over the same period.
We have not published a traffic growth figure. Third-party tools estimated a much larger traffic increase than Search Console measured, because those tools infer traffic from ranking position rather than counting it. When rankings jump, the estimate jumps with them. We have used measured data throughout.
We have not published a revenue figure. We do not have reliable average job values for this client, so any dollar figure would be a guess dressed up as a result.
Google Business Profile monthly figures are read from the platform’s own charts, which report in monthly buckets. Totals are exact. Month by month figures are approximate.
Want the same review of your own site?
We run the identical 60-point technical review as a standalone piece of work, covering Search Console, Google Business Profile and AI citation visibility together. You keep the findings whether or not you work with us.