
Short answer: if your rankings improved but your traffic didn’t, the visibility has probably moved to places that don’t produce website clicks. Local pack listings send people to your Google Business Profile. AI Overviews answer the question without anyone leaving the results page. Both are real, both generate leads, and neither shows up in a traffic report.
This post explains where that visibility actually went, why your reporting missed it, and the six things to measure instead.
The Conversation Nobody Enjoys
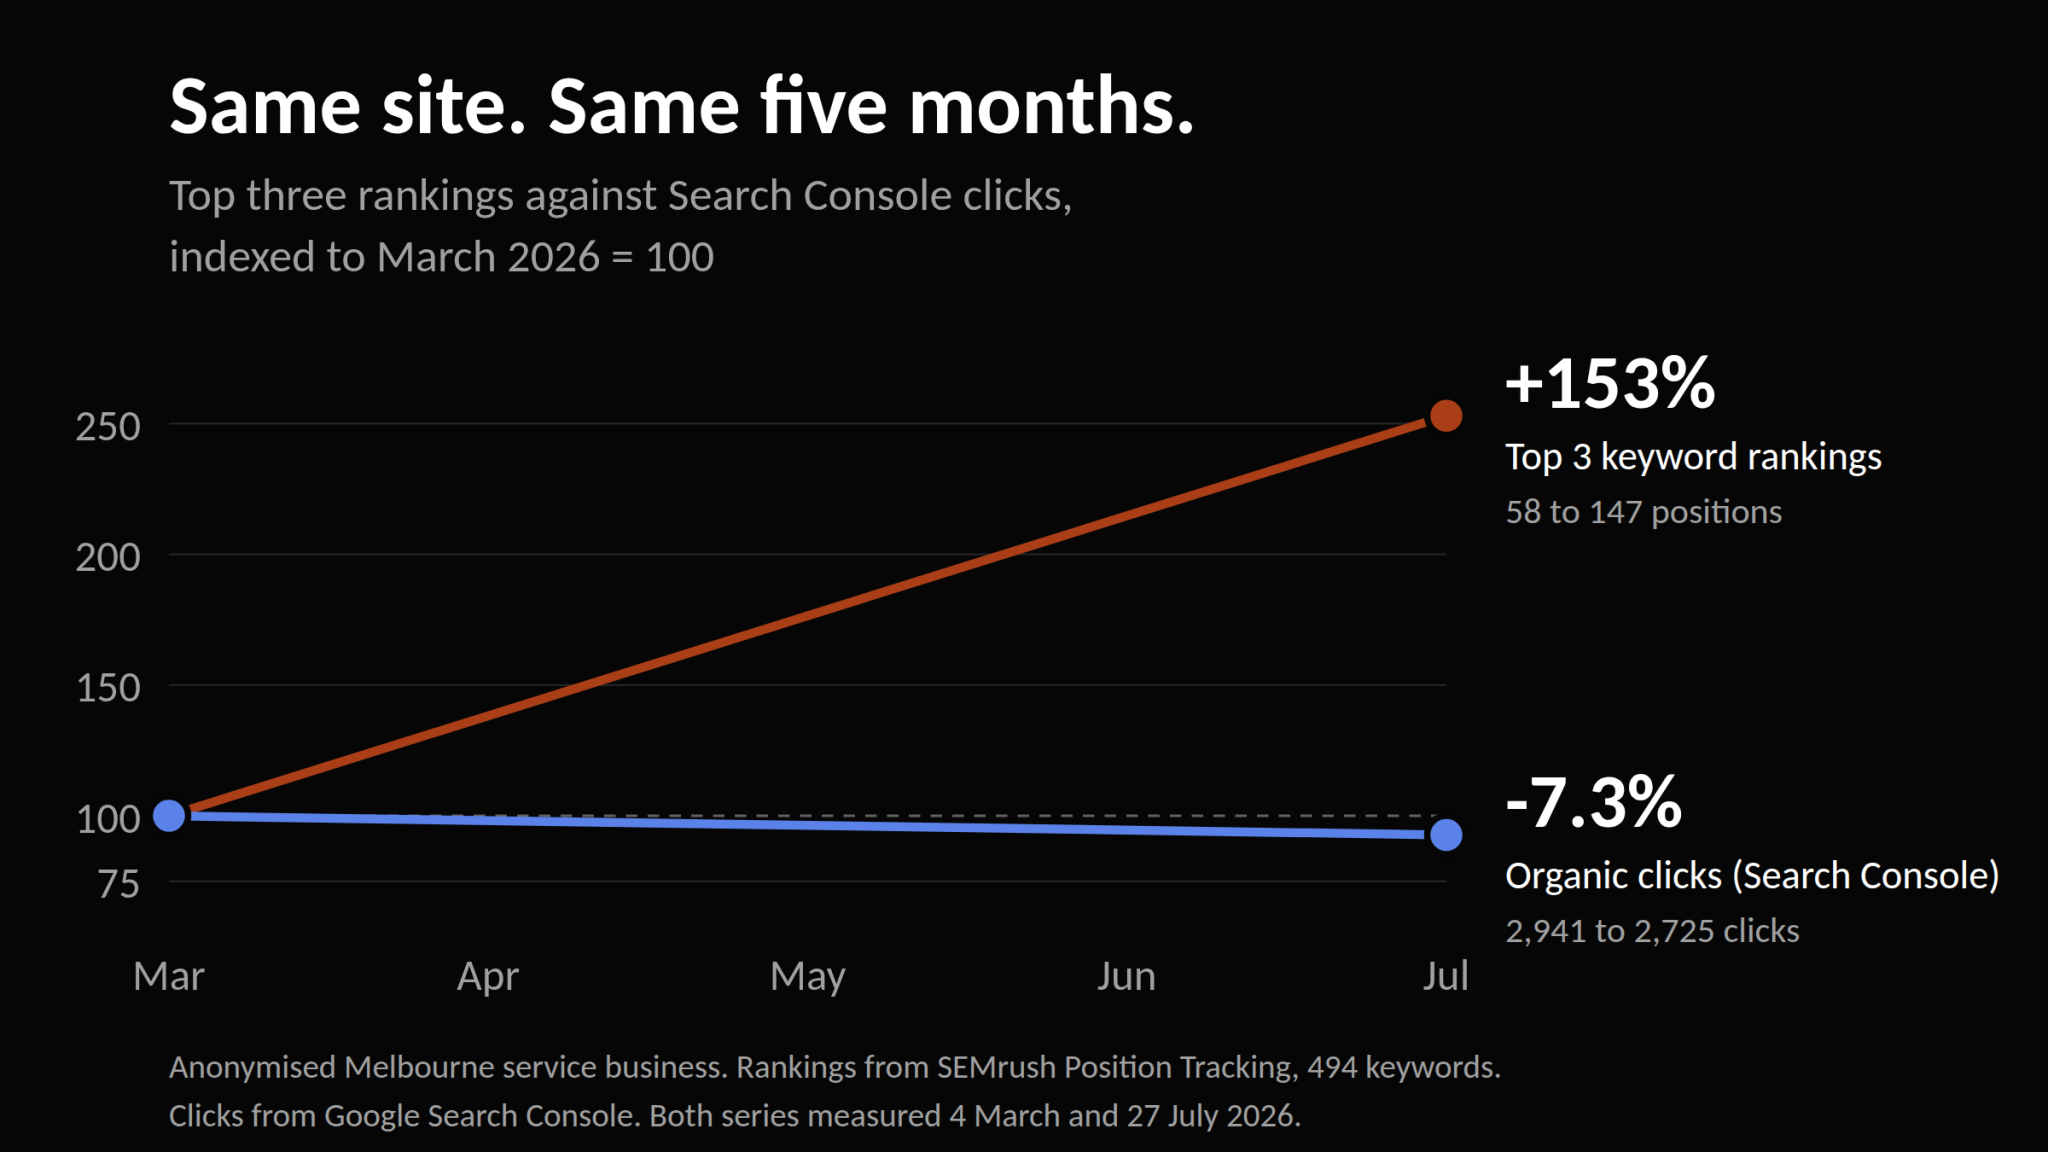
Five months into an engagement, the rankings report is excellent. Top three positions have gone from 58 to 147. Your client opens Google Analytics, sees traffic has gone sideways, and asks the obvious question.
It’s a fair question. It’s also, increasingly, the wrong one.
There’s a structural shift behind it. SparkToro’s June 2026 analysis of Similarweb clickstream data found that 68.01% of US Google searches now end without a click, up from 60.45% in 2024. Only 27.6% of searches send a click to the open web at all.
Rankings haven’t stopped working. What’s changed is the relationship between a ranking and a visit.
We ran into exactly this on a Melbourne rubbish removal client earlier this year. Rankings nearly tripled at the top of the results. Website clicks in Search Console went down 7.3%. On paper that looks like a failure. It wasn’t, and working out why changed how we report on every local client we have. The full numbers are in the case study.
Why Don’t Local Pack Rankings Show Up in Your Traffic Report?
The local pack is the boxed map with three business listings that sits above the organic results on a local search. Your position in it is a ranking, and rank tracking tools count it as one.
For a local service business in 2026, a typical results page is that map, an AI-generated summary, a review carousel and a “people also ask” block. The organic listings are somewhere below all of it.
Ranking tools count every one of those as a ranking. Search Console only counts clicks that land on your website.
On the client above, 494 keywords were tracked. Of the 420 now ranking, only 152 were classic organic listings. The other 268 were local pack, review carousel or AI Overview placements. Those positions are worth having. Arguably they’re worth more, because they sit above the organic results. But they don’t generate the kind of click Search Console was built to count.
If your rankings improved and your clicks didn’t, the first thing to check is what kind of rankings you gained.
Where Did the Leads Actually Go?
This is the one most reporting misses completely.
Clicks inside the local pack go to your Google Business Profile, not to your website. When someone finds you that way they can call you, request directions or read your reviews without ever touching your site. Those aren’t failed sessions. They’re leads.
A note on the numbers here, because it matters. You’ll see it claimed that the map pack takes 42 to 44% of local clicks. We tried to source that figure and couldn’t. Every trail we followed ended at an undated line with no study behind it, including on the site most people credit for it. So we’re not going to repeat it. Here’s first-party data instead.
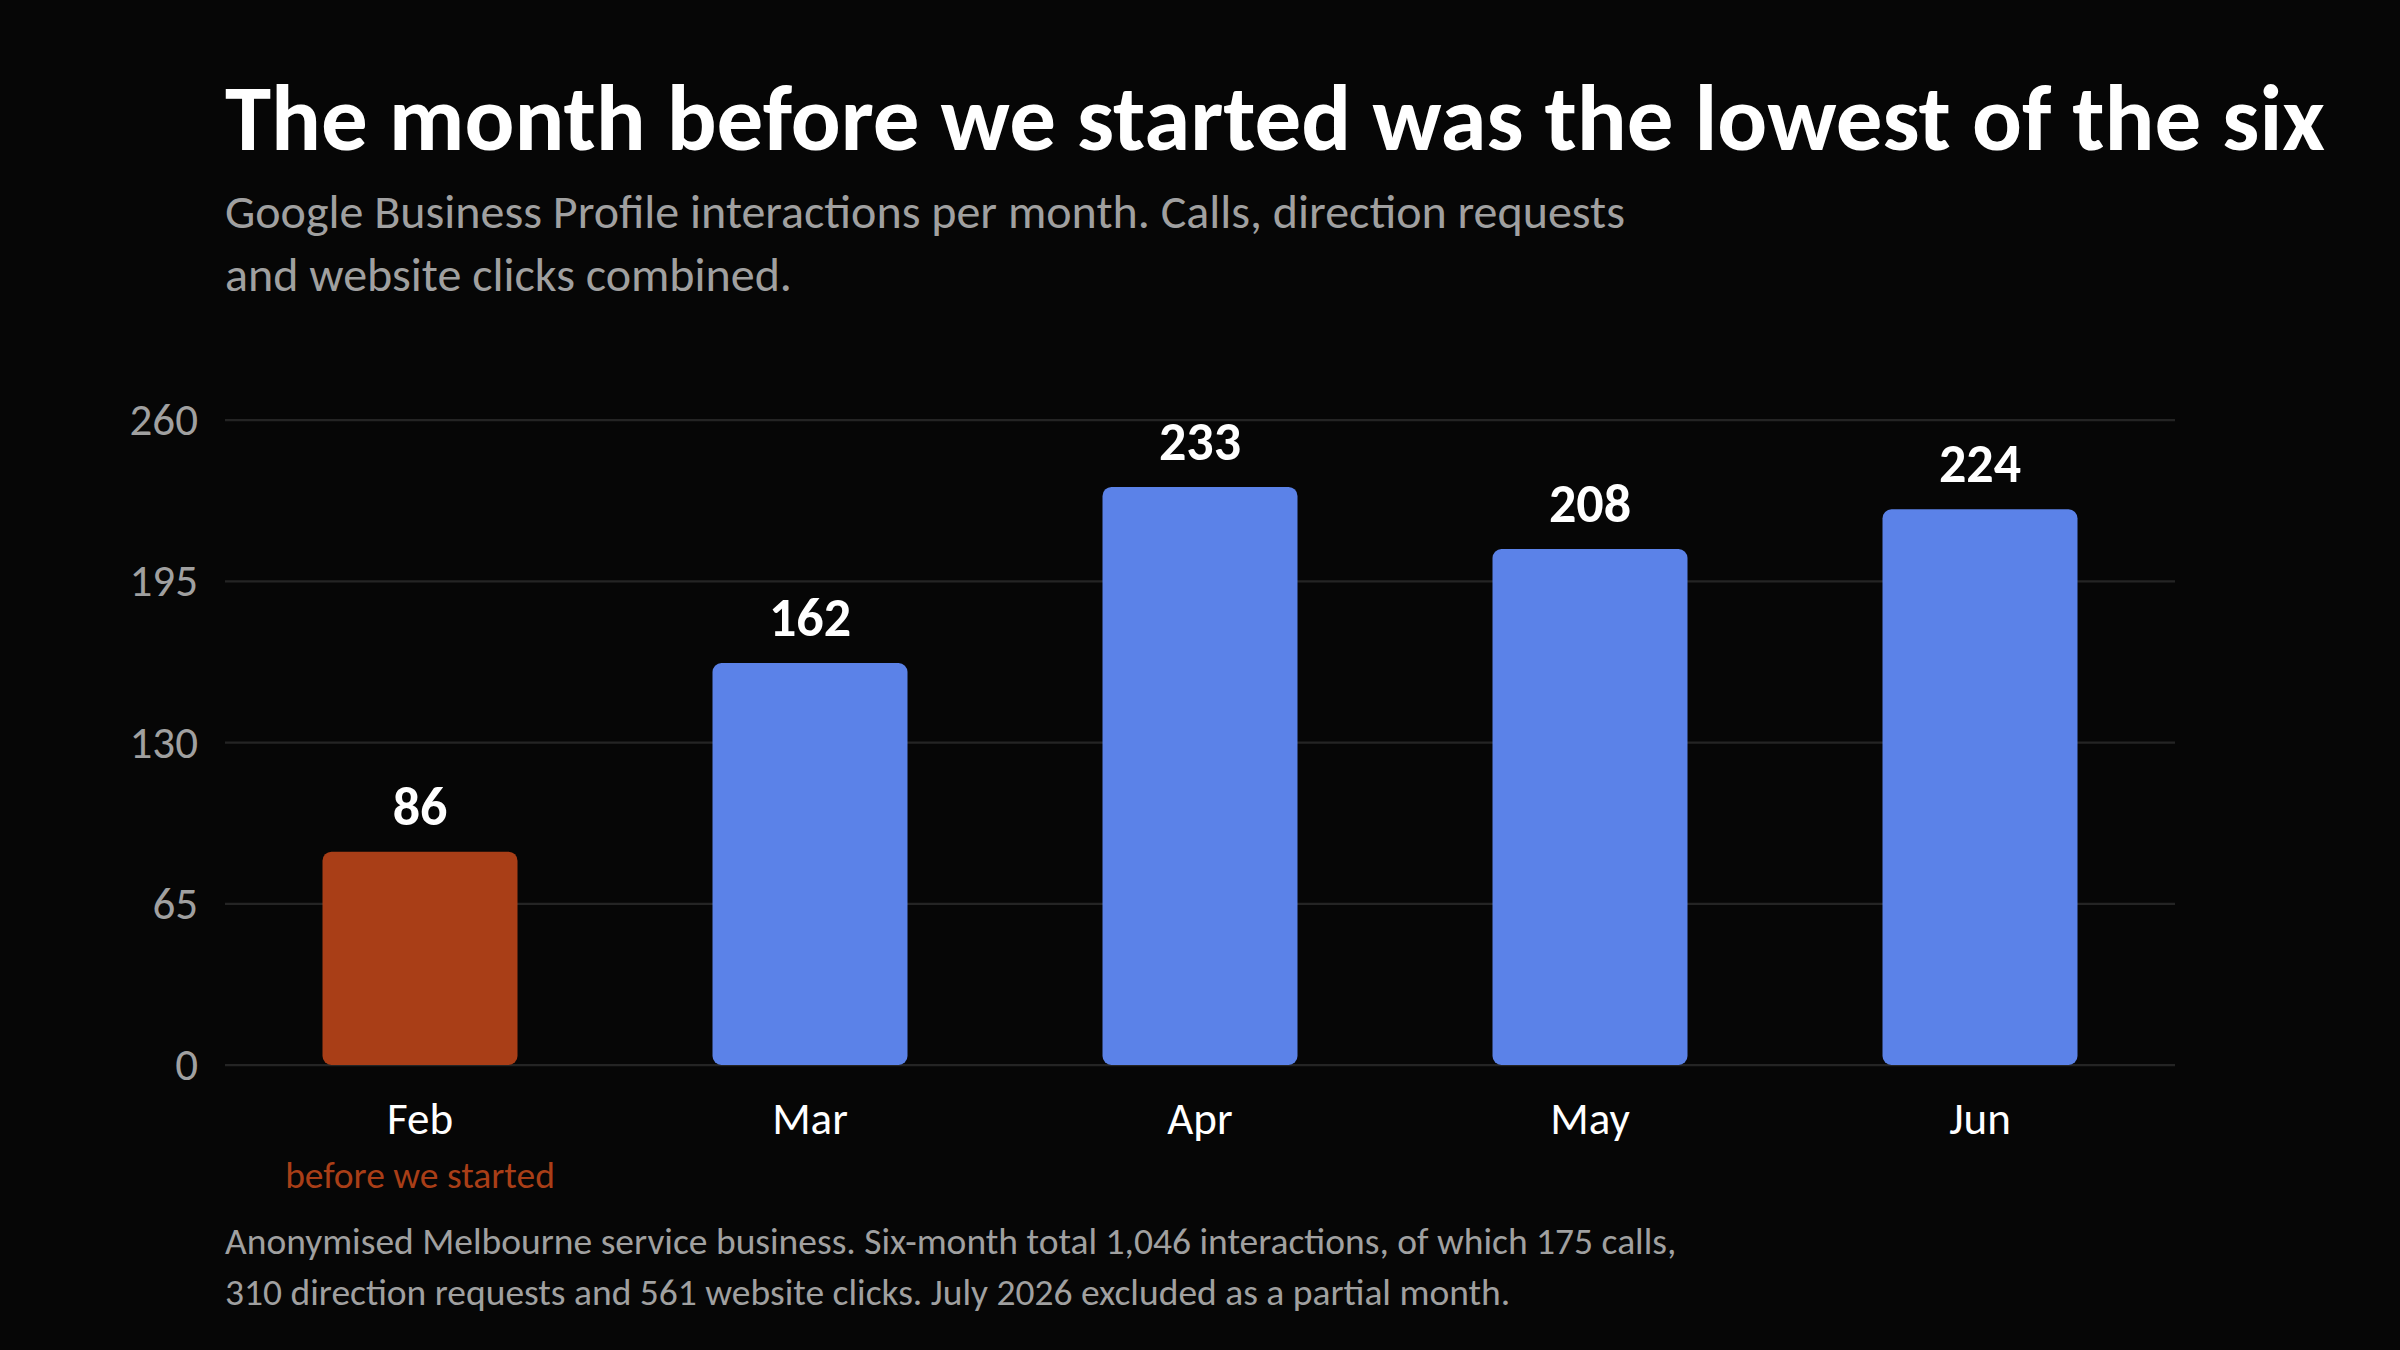
Here’s what six months looked like for the same client, as at 30 July 2026:
| Google Business Profile metrics | Total |
|---|---|
| Profile interactions | 1,046 |
| Calls direct from the profile | 175 |
| Direction requests | 310 |
| Website clicks from the profile | 561 |
| Profile views | 15,894 |
60% of the people who found that profile came through Google Maps, not Google Search. Every one of those calls and direction requests is a person who was ready to book. Not one of them appears in a website traffic report.
The month before the work started was the lowest month in the entire window on every one of those measures. Interactions roughly tripled by the second month.
Practical step: open your Business Profile, go to Performance, and set the date range as wide as it’ll go. Compare the month before your SEO work started against the months since. If calls and direction requests are up while website sessions are flat, you’ve found your answer.
Do AI Overviews Reduce Your Clicks?
An AI Overview is the AI-generated summary Google places at the top of many results pages, assembled from sources it cites inline.
Yes, they reduce clicks. But the honest answer is more specific than the headlines.
A pre-registered field experiment from Carnegie Mellon and the Indian School of Business tested this on 68,089 real searches. It found AI Overviews cut organic clicks by 39.8% where they appear.
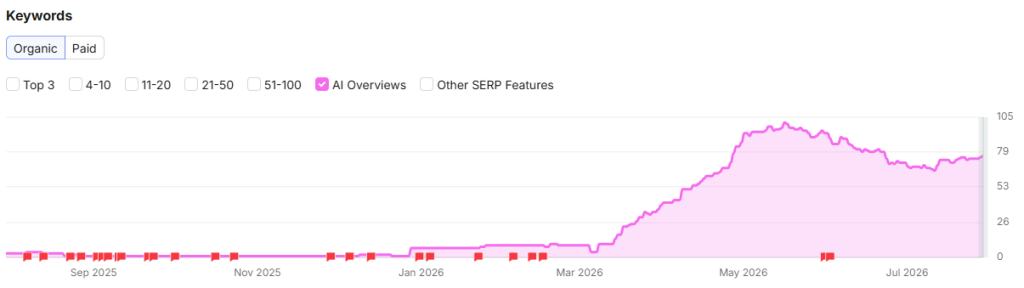
Here’s the part most articles skip. That effect came almost entirely from informational queries, which made up 71% of the sample. For transactional and navigational queries, the effect wasn’t statistically distinguishable from zero. Seer Interactive’s April 2026 data shows why. AI Overviews appear on 36% of informational queries, but only 8% of commercial and 5% of transactional ones.
So if your keywords are commercial, AI Overviews probably aren’t your main explanation. For the client above, 129 of their 190 top three keywords were commercial or transactional. That’s why we landed on seasonality and the local pack shift as the real cause of their flat click count.
Google AI Mode is a different matter. Semrush analysed around 69 million US desktop sessions and found 92 to 94% of AI Mode sessions ended without a click to any external site. That’s a single-vendor, desktop-only sample from mid 2025. Treat it as a signal rather than a settled number.
What AI Overviews really change is who gets the credit. Being the source an answer is built from is a kind of visibility that didn’t exist three years ago, and it doesn’t follow from ranking well.
Ahrefs analysed 863,000 keywords and found only 38% of AI Overview citations come from pages in Google’s top ten. A year earlier it was 76%. That collapse is the single most important number in this article. SE Ranking studied 10,000 US keywords and found only around 14% of URLs cited in AI Mode also appear in the organic top ten.
Your ranking report is not a proxy for your AI visibility. If you’re not measuring citations separately, you’re not measuring them. Our AI search FAQs cover the basics.
Are You Comparing Your Best Season Against Your Worst?
This one is embarrassingly common and entirely self-inflicted.
Melbourne rubbish removal peaks in spring and summer. Demand falls away from May. If your engagement started in March and you compare March to July against the preceding October to February, you’ve compared the quietest five months of the year against the busiest. Then you’ve blamed your SEO for the difference.
For this client, that comparison alone accounts for most of the apparent decline.
Two other things finished the job. One seasonal blog post about hard rubbish collection lost 233 clicks as its season passed, which was more than the entire site-wide fall on its own. And branded searches dropped 25%, which is offline word of mouth rather than anything happening in search.
Practical step: always compare year on year, not against the period immediately before. Search Console only keeps 16 months of data, so if you want a year on year comparison next spring, export it now.
What’s a Ranking Position Actually Worth Now?
Less than it was. And nobody can tell you exactly how much less.
We went looking for a current click-through rate curve to answer this properly and came away unable to recommend one. Published estimates for position one range from roughly 8% of clicks to roughly 40%, depending on whose methodology you accept. The curve most widely quoted in 2026 carries a 2026 label but was last updated in mid 2025 and discloses no methodology. If someone shows you a neat CTR table, ask where it came from.
What the evidence does agree on is the direction, and it’s steep.
Ahrefs compared 300,000 keywords with and without AI Overviews. Where an AI Overview appears, top-ranking pages see 58% lower click-through rate. Eight months earlier that figure was 34.5%. Position two lost roughly half its clicks. A separate Search Console study across 200,000 keywords found position one falling from 28% to 19% year on year.
Here’s what that means for you. A position is a smaller thing than it was twelve months ago, and it’s still shrinking. A ranking report can show broad improvement across positions four to twenty and still produce almost no extra traffic. The gains sit in the top three. And the top three are worth less than they used to be.
That’s not an argument for giving up on rankings. It’s an argument for not turning them into a projected traffic number and calling it a forecast.
Is Your Tool Estimating Your Traffic, Not Measuring It?
Almost certainly, if the number came from a rank tracker.
SEMrush and Ahrefs don’t measure your traffic. They estimate it from your ranking position, the search volume for the keyword, and an assumed click-through rate. When your rankings improve the estimate improves, whether or not a single extra person visited your site.
On this client the estimate was running at roughly five times what Search Console actually measured.
Use estimated traffic for trend direction. Use Search Console for anything you’re going to say out loud.
The 6 Things You Should Measure Instead
If you run a local service business, here’s the reporting set we’d argue for.
- Share of search visibility against your named competitors, not your ranking in isolation. Your position matters less than your slice of the market. On the client above, visibility share went from 13.40% to 24.12%, the biggest gain of any competitor in that market, while raw traffic looked flat.
- Business Profile interactions, split into calls, direction requests and website clicks. This is where local demand actually lands.
- AI citations. How often you’re mentioned, and how many of your pages are being drawn from. Google added a Generative AI performance report to Search Console in mid 2026, under Performance, showing impressions inside AI Overviews and AI Mode. It deliberately won’t give you clicks or query-level data, so pair it with a dedicated citation tracker.
- Zero-click displacement rate. For keywords where AI features appear, track impressions against clicks over time. A widening gap tells you visibility is turning into answers rather than visits, before it shows up anywhere else.
- Conversion rate on the pages you optimised, not site-wide traffic. On the five service pages that got the full treatment, sessions rose 29% and conversions rose 51%, while the rest of the site went the other way with the season.
- Branded search volume and direct traffic, as proxies. If people see you in AI answers and map packs without clicking, some come back later by name. That shows up here and nowhere else.
When It Really Is Bad News
There’s a version of this article that’s an excuse, and this isn’t it.
Sometimes rankings go up and traffic goes nowhere because the rankings are on terms nobody valuable is searching. If your top three positions are all informational keywords that’ll never produce a booking, the traffic problem is real and the ranking report is a distraction.
The test is straightforward. Look at the intent behind the keywords you gained. Commercial and transactional pages hold their click potential far better, because AI Overviews appear on only 5% of transactional and 8% of commercial queries against 36% of informational ones.
On the client above, 129 of the 190 top three keywords carried commercial or transactional intent. Terms like “garbage removal melbourne” at 1,300 searches a month, which moved from position five to position one. That’s demand from people ready to book.
If your agency’s ranking wins are all “how to dispose of a mattress” and none of them are “mattress removal near me”, ask a harder question.
What to Do This Week
- Open your Google Business Profile, go to Performance, set the widest date range available, and compare the month before your SEO work began against the months since.
- In Search Console, check impressions and average position alongside clicks. If impressions are up and clicks are flat, that’s the pattern described here.
- In Search Console, open the Generative AI performance report under Performance. If you’ve never looked at it, you’ve never seen your AI Overview impressions.
- Ask your agency for a share of voice report against named competitors, not just a ranking list.
- Ask whether they’re tracking AI citations at all. If the answer is no, and only 38% of AI Overview citations now come from top ten pages, your ranking report isn’t covering it.
- Export your Search Console data now if you want a clean year on year comparison in twelve months. Sixteen months is all you get.
The Takeaway
Traffic was the right proxy for visibility when a search result was ten blue links. It isn’t any more.
A local service business can gain significant, commercially valuable visibility in 2026 while its website traffic goes sideways. The visibility has moved to the map pack, the review carousel and the AI answer.
The work hasn’t stopped producing results. The results have stopped arriving as sessions. If you’re still measuring only sessions, you’re going to fire an agency that’s winning.
Ready to Find Out Where Your Leads Went?
Every technical fix, the complete ranking data and the full methodology are in the case study on this five-month engagement.
If you want the same review of your own site, we run a 60-point technical review covering Search Console, Google Business Profile and AI citation visibility together. Get your free GEO and SEO audit or get in touch.
Frequently asked questions
Why did my rankings improve but my traffic stay the same?
Usually because the visibility you gained is in the local pack, the review carousel or an AI Overview, none of which produce a standard organic click. Check your Google Business Profile performance and your Search Console impressions before concluding the work is not producing results.
Do AI Overviews reduce organic traffic?
Yes, but unevenly. A pre-registered randomised field experiment covering 68,089 searches found a 39.8% reduction in organic clicks on queries where an AI Overview appears. The effect was driven by informational queries. For transactional and navigational queries it was not statistically distinguishable from zero, so the impact depends heavily on what your pages target.
Does the local pack send traffic to my website?
Mostly not. Local pack and Maps results drive calls, direction requests and review reads on your Google Business Profile. Only the website link sends a visitor to your site, and around 61% of profile discovery on the client in this article happened in Maps rather than Search.
Why does SEMrush show more traffic than Google Search Console?
Because SEMrush estimates traffic from your ranking positions and search volumes rather than measuring it. When rankings improve the estimate rises automatically. Search Console counts actual clicks, so treat it as the source of truth.
What is a number one ranking worth in 2026?
Nobody can tell you precisely, and be wary of anyone who says otherwise. Published estimates for position one range from about 8% to about 40% of clicks depending on methodology. What is measurable is the trend: Ahrefs found top-ranking pages see 58% lower click-through rate when an AI Overview is present, up from 34.5% eight months earlier.
Is AI search traffic worth having if it is smaller?
The evidence is turning that way. Adobe’s analysis of US retail traffic found AI-referred visitors converted 54% better than non-AI traffic in May 2026, generating 53% more revenue per visit and spending 53% longer on site. Worth noting that Adobe’s own earlier data had AI traffic converting worse as recently as 2025, so this is a trend rather than a settled fact. Fewer visits, better ones.