

- Client
- A suburban veterinary clinic in Australia (anonymized)
- Industry
- Veterinary care: general practice and surgery
- Market
- Local, with pet health content read nationally and overseas
- Measured
- July to September 2026, compared with July to September 2025
At a glance
| Metric | Jul to Sep 2025 | Jul to Sep 2026 | Change |
|---|---|---|---|
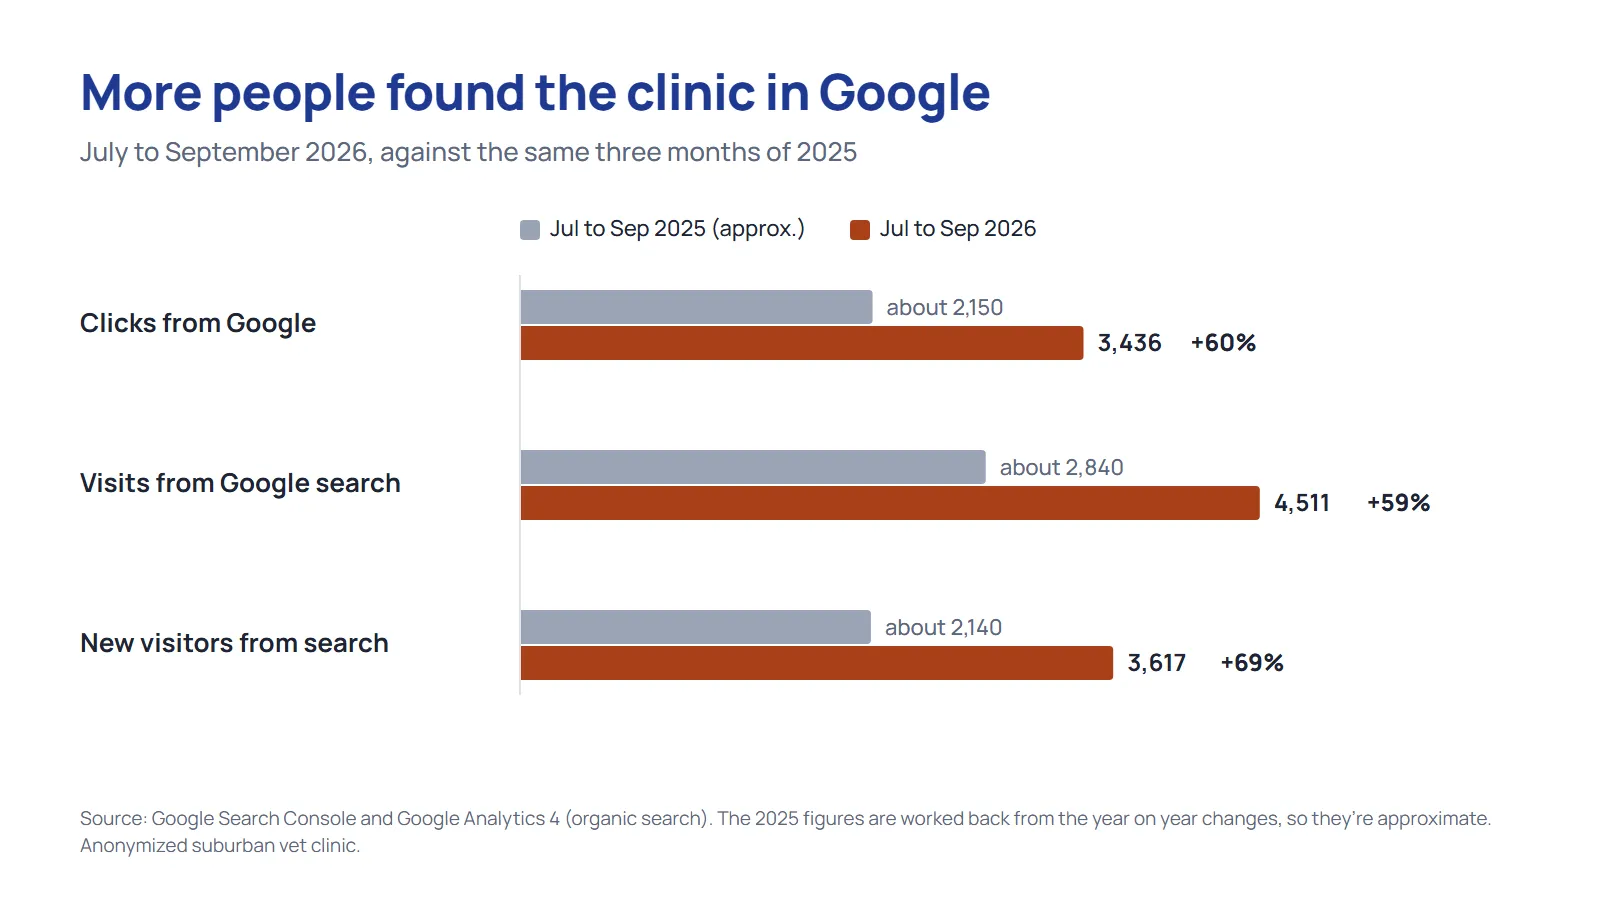
| Clicks from Google | about 2,150 | 3,436 | +60% |
| Visits from Google search | about 2,840 | 4,511 | +59% |
| New visitors from search | about 2,140 | 3,617 | +69% |
| Times the site appeared in Google | about 274,000 | 444,600 | +62% |
| Average ranking position | about 26 | 9.0 | About 17 places better |
| Inquiries and bookings from search | about 650 | 699 | +7% |
| Google Business Profile views | about 8,800 | 12,212 | +39% |
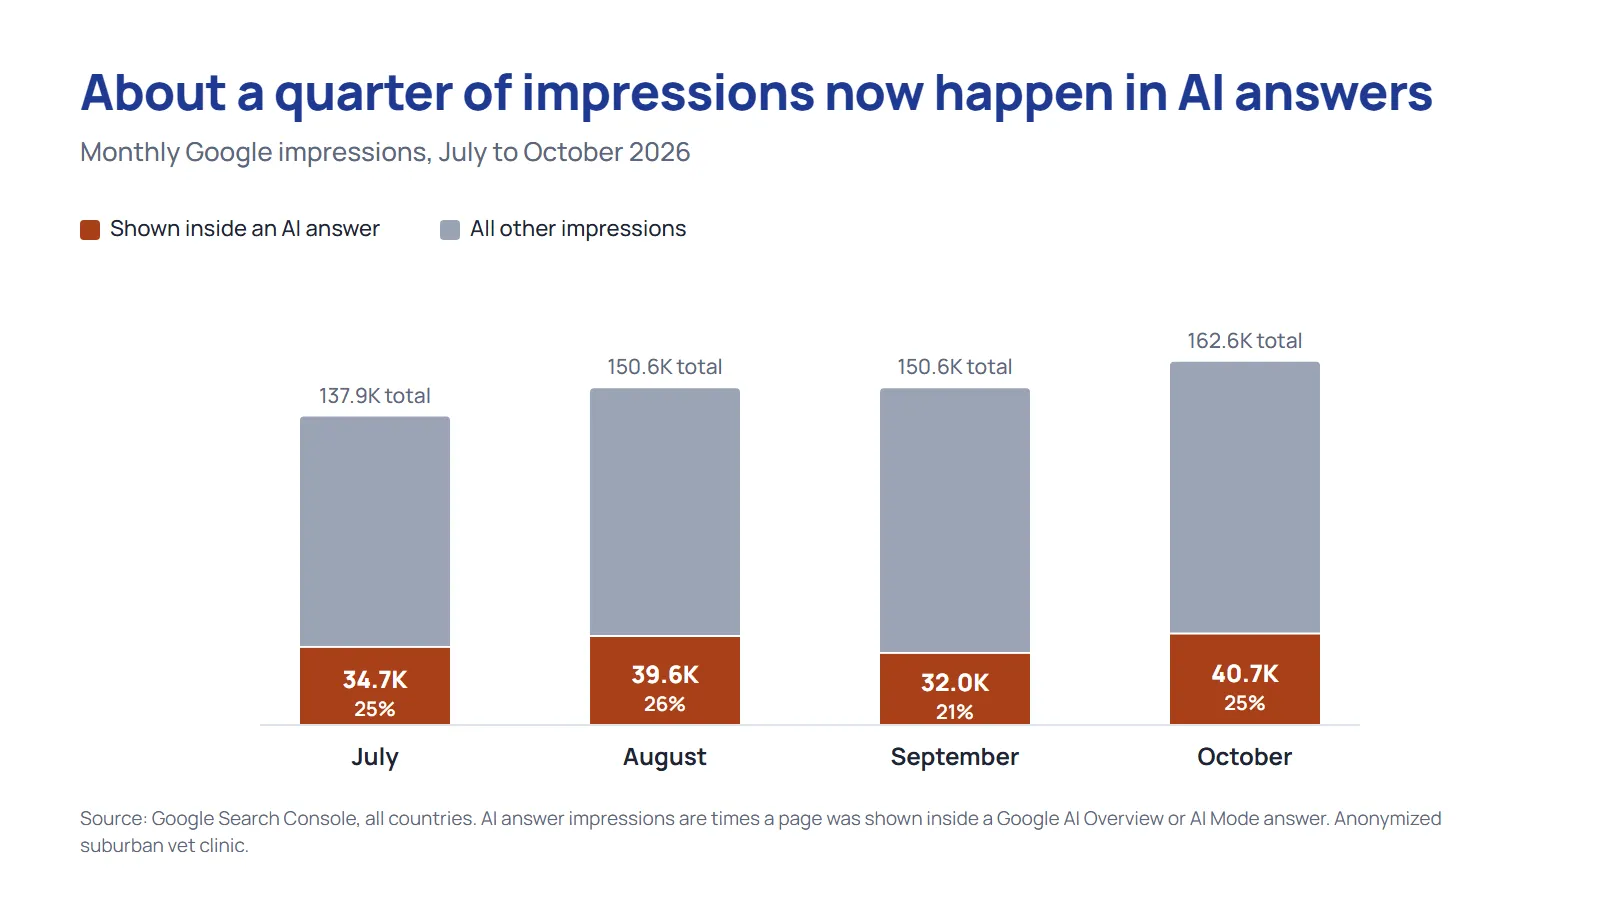
On top of that, about a quarter of the times Google shows this clinic now happen inside its AI answers. That’s roughly 40,000 AI answer impressions in October alone.
The last row of the search table is the one I’d point you to first, though. Inquiries rose 7%, not 60%. I’ll explain why further down, because it’s the most useful part of this case study.
The situation
A year earlier, the clinic’s average position in Google was about 26. For most searches that’s page three, where almost nobody looks.
The website was built around service pages. That’s fine for someone who already knows they need a dental clean or a desexing appointment. But pet owners don’t start there. They start with a worry: why is my dog’s eye red, is kibble bad for him, what does this lump mean. The clinic had almost nothing that answered those questions, so it was invisible at the exact moment people were deciding whether they needed a vet at all.
What I did
Four things, over twelve months. None of them is a trick.
1. Condition and care guides, reviewed by the clinic’s vets
I planned a run of guides on the questions pet owners actually search, and each one was written with the clinic’s vets and credited to a named vet. These are health topics. A named, qualified author is the minimum a worried owner should expect, and it’s the clinic’s real expertise on the page rather than generic advice.
What they did in the July to September 2026 quarter:
- A guide to a common eye problem in dogs (published December 2025) brought in 383 clicks, more than any other article on the site.
- A general dog health guide (September 2025) grew from 5 clicks a year earlier to 231.
- Two dog nutrition articles (July 2026) brought in 239 clicks in their first quarter.
- Five more condition guides (October 2025 to June 2026) brought in more than 320 clicks between them.
- An older dental article I refreshed more than doubled its clicks, to 116.
2. New surgery and service pages
I added pages for procedures people search by name: a page for a breathing surgery common in flat-faced breeds (October 2025), another surgical procedure moved into the main menu, and two more procedure pages in mid 2026. By the end of September, both surgical pages ranked on page one, one of them in first place. I also rewrote the pet nutrition service page in September 2026 so it links to the new nutrition articles.
3. Technical and on-page fixes
The unglamorous list: a rebuilt homepage services section, broken links fixed, weak page titles and descriptions rewritten, service pages tightened around the terms people use, and blog navigation repaired so every article could actually be reached. In August 2026 I rebuilt the blog categories around the clinic’s services and mapped all 40 articles into them.
4. Google Business Profile
A full audit in March 2026: service descriptions rewritten, surgery services added, regular posts, and opening hours and holiday closures kept accurate all year.
What happened in Google search
Clicks rose 60% and visits from search rose 59%. More telling is the 69% rise in new visitors: most of the growth is people who’d never been to the site before.
The average position moved from about 26 to 9.0. That’s the difference between page three and page one for a large share of the searches the clinic shows up for.
What happened in AI answers
Google now shows this clinic’s pages inside its AI answers on a large share of searches. Search Console started reporting these impressions in mid 2026:
| Month | AI answer impressions | Share of all impressions |
|---|---|---|
| July 2026 | 34,700 | 25% |
| August 2026 | 39,600 | 26% |
| September 2026 | 32,000 | 21% |
| October 2026 | 40,700 | 25% |
A few specifics from the daily rank tracking:
- The breathing surgery page was cited at the top of Google’s AI answer for its procedure almost every day from 1 July to 15 September 2026. It dropped out on 16 September and was back on 8 days in October.
- The second surgical page went from not ranking at the start of September to being cited at the top of the AI answer for its procedure from 28 September.
- The eye problem guide was cited in the AI answer for a common eye symptom search in September, and clicks to the guide rose from 107 to 157 between August and September.
- One of the new nutrition articles went from 126 AI answer impressions in its first weeks to 1,918 in August and 2,876 in October.
Two honest caveats. First, these placements come and go. Google refreshes its AI answers constantly, and one surgical page here has dropped in and out five times. I report how many days a page holds a citation, never “we rank #1 in AI”. Second, an AI answer can cost you clicks. In October, a guide on a common cat skin complaint was shown inside AI answers more than twice as often (3,794 to 8,820 impressions), and its clicks fell from 30 to 22. The answer was given on the results page, so fewer people needed to click.
What happened on Google Business Profile
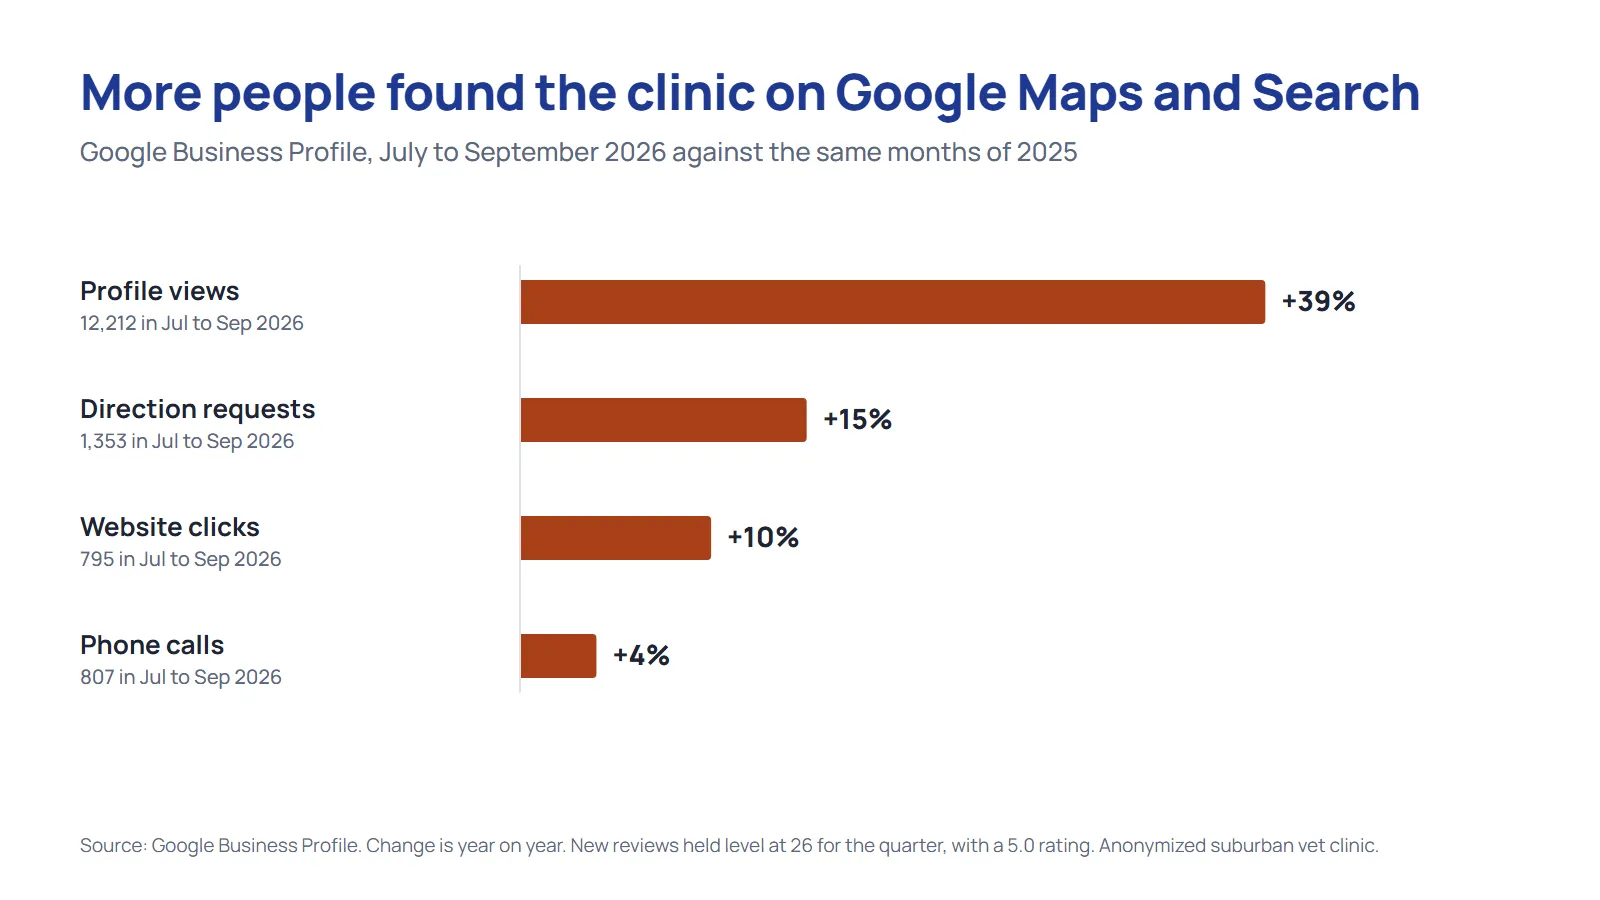
| Metric | Jul to Sep 2026 | Change on 2025 |
|---|---|---|
| Profile views on Search and Maps | 12,212 | +39% |
| Direction requests | 1,353 | +15% |
| Website clicks | 795 | +10% |
| Phone calls | 807 | +4% |
| New reviews | 26 | Same, 5.0 rating |
What didn’t go up
Inquiries and bookings from search rose 7%, to 699. Traffic rose 59%. So the share of search visitors who inquire fell by about a third.
That’s not a tracking fault, and it’s not a failure. It’s what happens when most of your growth comes from people researching a symptom. Someone reading about red eyes in dogs at 10pm may book next week, or may never need to. Some will book a different clinic closer to home. A traffic chart can’t tell you which, and I won’t pretend it can.
What I’m doing about it: linking each guide to the matching service page and the booking page, so the reader who does need a vet has the shortest possible path to one.
A couple of searches also went backward. Searches for one type of pet care slipped because Google was splitting them between two overlapping pages, which I’m merging into one. A neighboring suburb’s searches slipped too, and I’m adding local detail to the key service pages to win them back.
If you’ve been told your traffic is up but the phone isn’t ringing more, my article Rankings Up but Traffic Flat? Here’s Why covers the other side of the same problem.
What I’m doing next
- Build out more nutrition content around the rewritten pet nutrition page.
- Get the puppy pages live before the December and January new pet peak.
- Merge the duplicate pages that are splitting the same searches.
- Refresh the older condition guides that are losing ground, starting with the ones that rank just off page one.
- Two new guides went live in late October. I’ll report on them with the Q4 data.
Methodology and limitations
Sources. Google Search Console (all countries), Google Analytics 4 (organic search), Google Business Profile, and daily rank tracking in SEMrush.
The 2025 figures are approximate. They’re worked back from the year on year percentages in the clinic’s reporting dashboard, because the raw 2025 exports weren’t kept. The 2026 figures are read directly.
Not every visitor is local. Pet health articles get read well beyond the clinic’s suburb. In October, more AI answer impressions came from the US (14,056) than from Australia (13,079). That’s why I judge this work on bookings and profile actions, not traffic alone.
I haven’t published a keyword count. The tracked keyword set grew during the year, so “keywords in the top three” isn’t a like for like comparison. On the searches tracked in both years, results are mixed.
I haven’t published a revenue figure. I don’t have reliable booking values for this clinic, and a guess dressed up as a result helps nobody.
Want the same review of your own site?
I’ll look at your Search Console, Google Business Profile and AI answer visibility together, and tell you what’s worth doing first. You keep the findings whether or not you work with me.